In this video, I build an indoor (and outdoor?) air quality monitor:
Motivation
For years I’ve followed the “uRadMonitor”, a device that does air quality monitoring and radiation monitoring. I’ve played with geiger counter projects before and frankly found them to be not very interesting. However, the idea of monitoring air quality is something that seemed like it might yield interesting data. For example, as I’ve started to become involved in 3D printing, it would be useful to see whether or not 3D printing affected the air quality. It would also be useful to correlate my results with what my region reports for outdoor air quality.
I purchased enough parts to build four of these monitors and currently have two constructed. One is deployed inside my office, the other is outside. Might throw one in the attic or the crawlspace just to see what happens…
Choosing Sensors
This part was easy, I just chose the same sensors that the uRadMonitor folks did:
- Bosch BME-680. This one provides temperature, pressure, and volatile organic compounds. The VOC sensor I have not had the greatest luck with, as it seems difficult to interpret the results. There are some resources on the web that might be helpful in calibrating and interpreting the results.
- Winsen ZH03B Laser Dust sensor. This one was the primary one I was interested in, as I find my office gets pretty dusty. It measures particulate matter at three levels, PM1.0, PM2.5, and PM10.
- Winsen MH-Z19B Infrared CO2 sensor. CO2 is of course what we humans exhale, so the more humans you have in an enclosed space, the more the CO2 goes up. This is very evident in the sensor readings every time I enter my office in the morning.
- Winsen ZE08-CH2O Formaldehyde sensor. I picked this because the uRadMonitor folks also did. I suppose Formaldehyde is a chemical given off in various manufacturing processes, so it would be interesting to see what happens when I’m working on 3D printing, soldering projects, etc. I haven’t noticed much interesting on this sensor, other that I had one huge spike where the levels went up 1400% back in February. Unfortunately, I have no idea what I did.
- Winsen ZE25-O3 Ozone Sensor. I don’t have these yet; they’re on order.
- Winsen ZP07-MP901 aor quality sensor. I don’t have these yet either, ordered them to correlate their behavior with the BME680.
The winsen sensors are all serial devices, typically operating at 9600 baud. They have one transmit and one receive line each.
Designing a breakout board
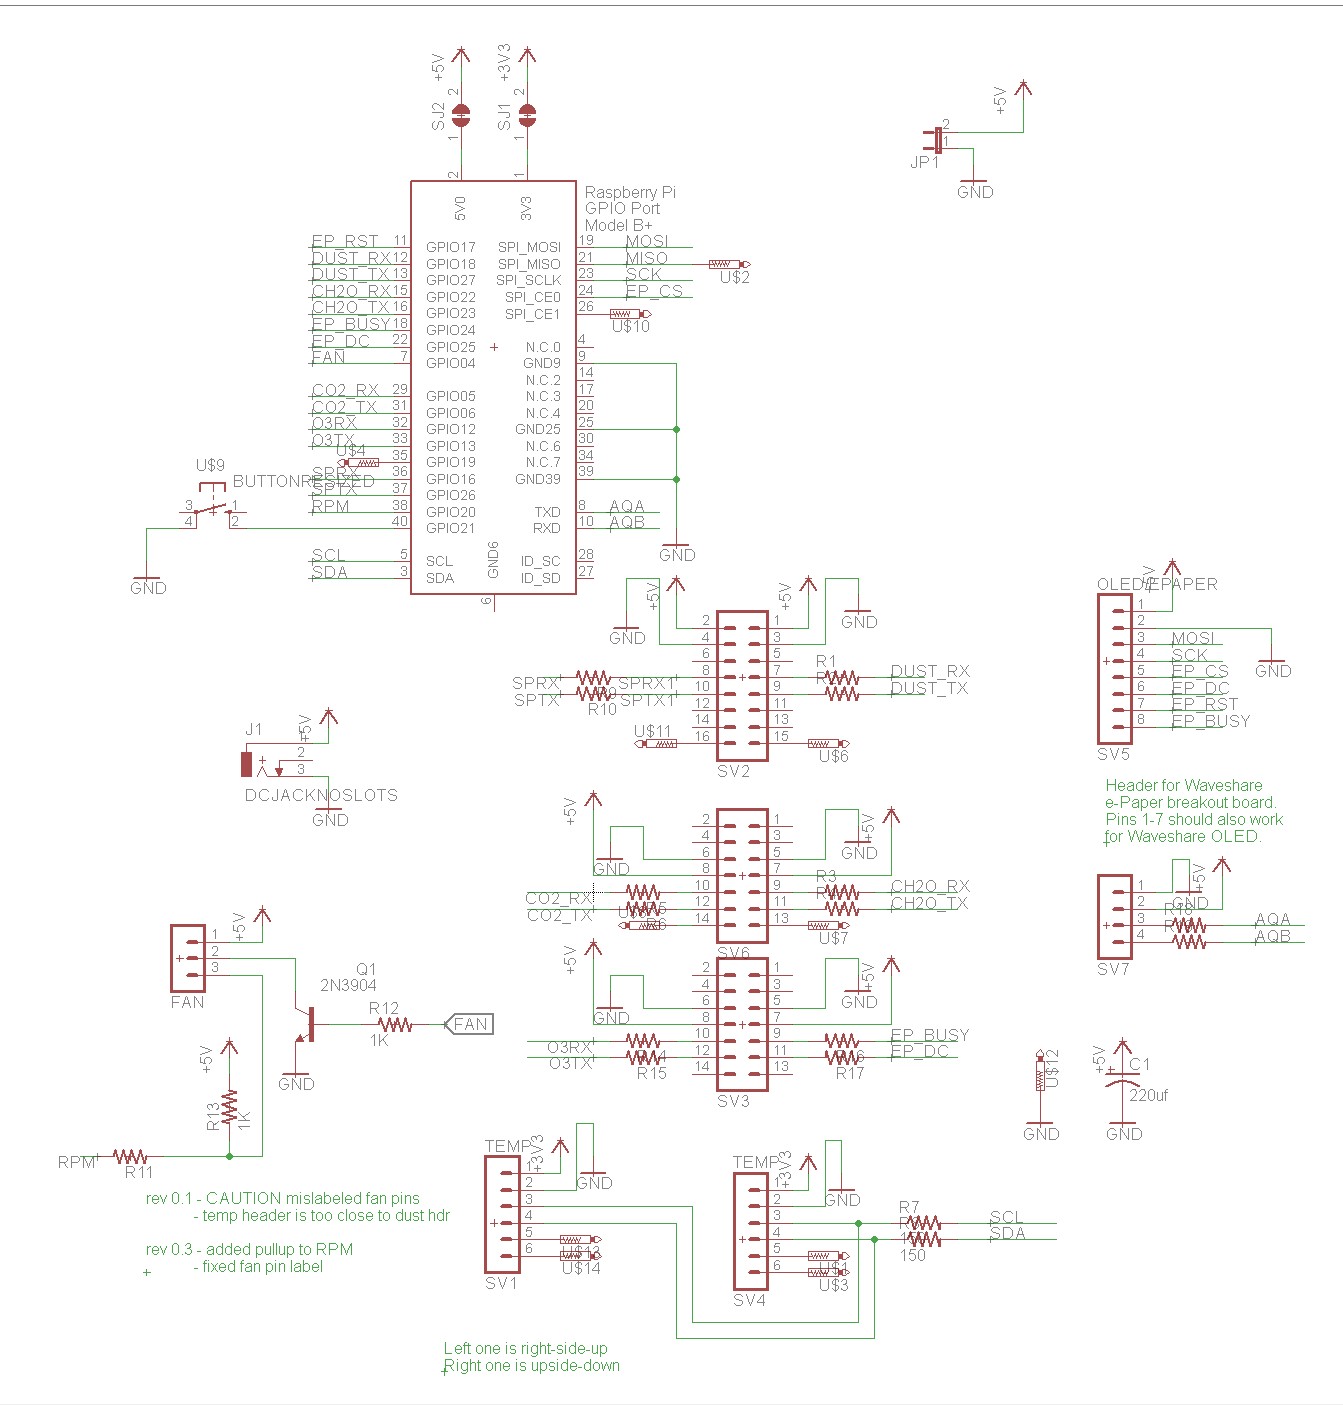
Rather than having a ratsnest connected to the pi’s GPIO board, I wanted to build a breakout board that would break each sensor’s wires out separate. This is what I settled on:
As you can see, this board is just a bunch of connectors and resistors. The resistors are likely unnecessary, but I like to throw protection resistors in my raspberry pi projects, just in case a foolish programing mistake should misconfigure and input as an output. The resistors are 1K unless stated otherwise (ones on the I2C for the BME680 are 150 ohm or less). There’s a fan driver that can PWM a fan to generate ventilation.
Building the prototype
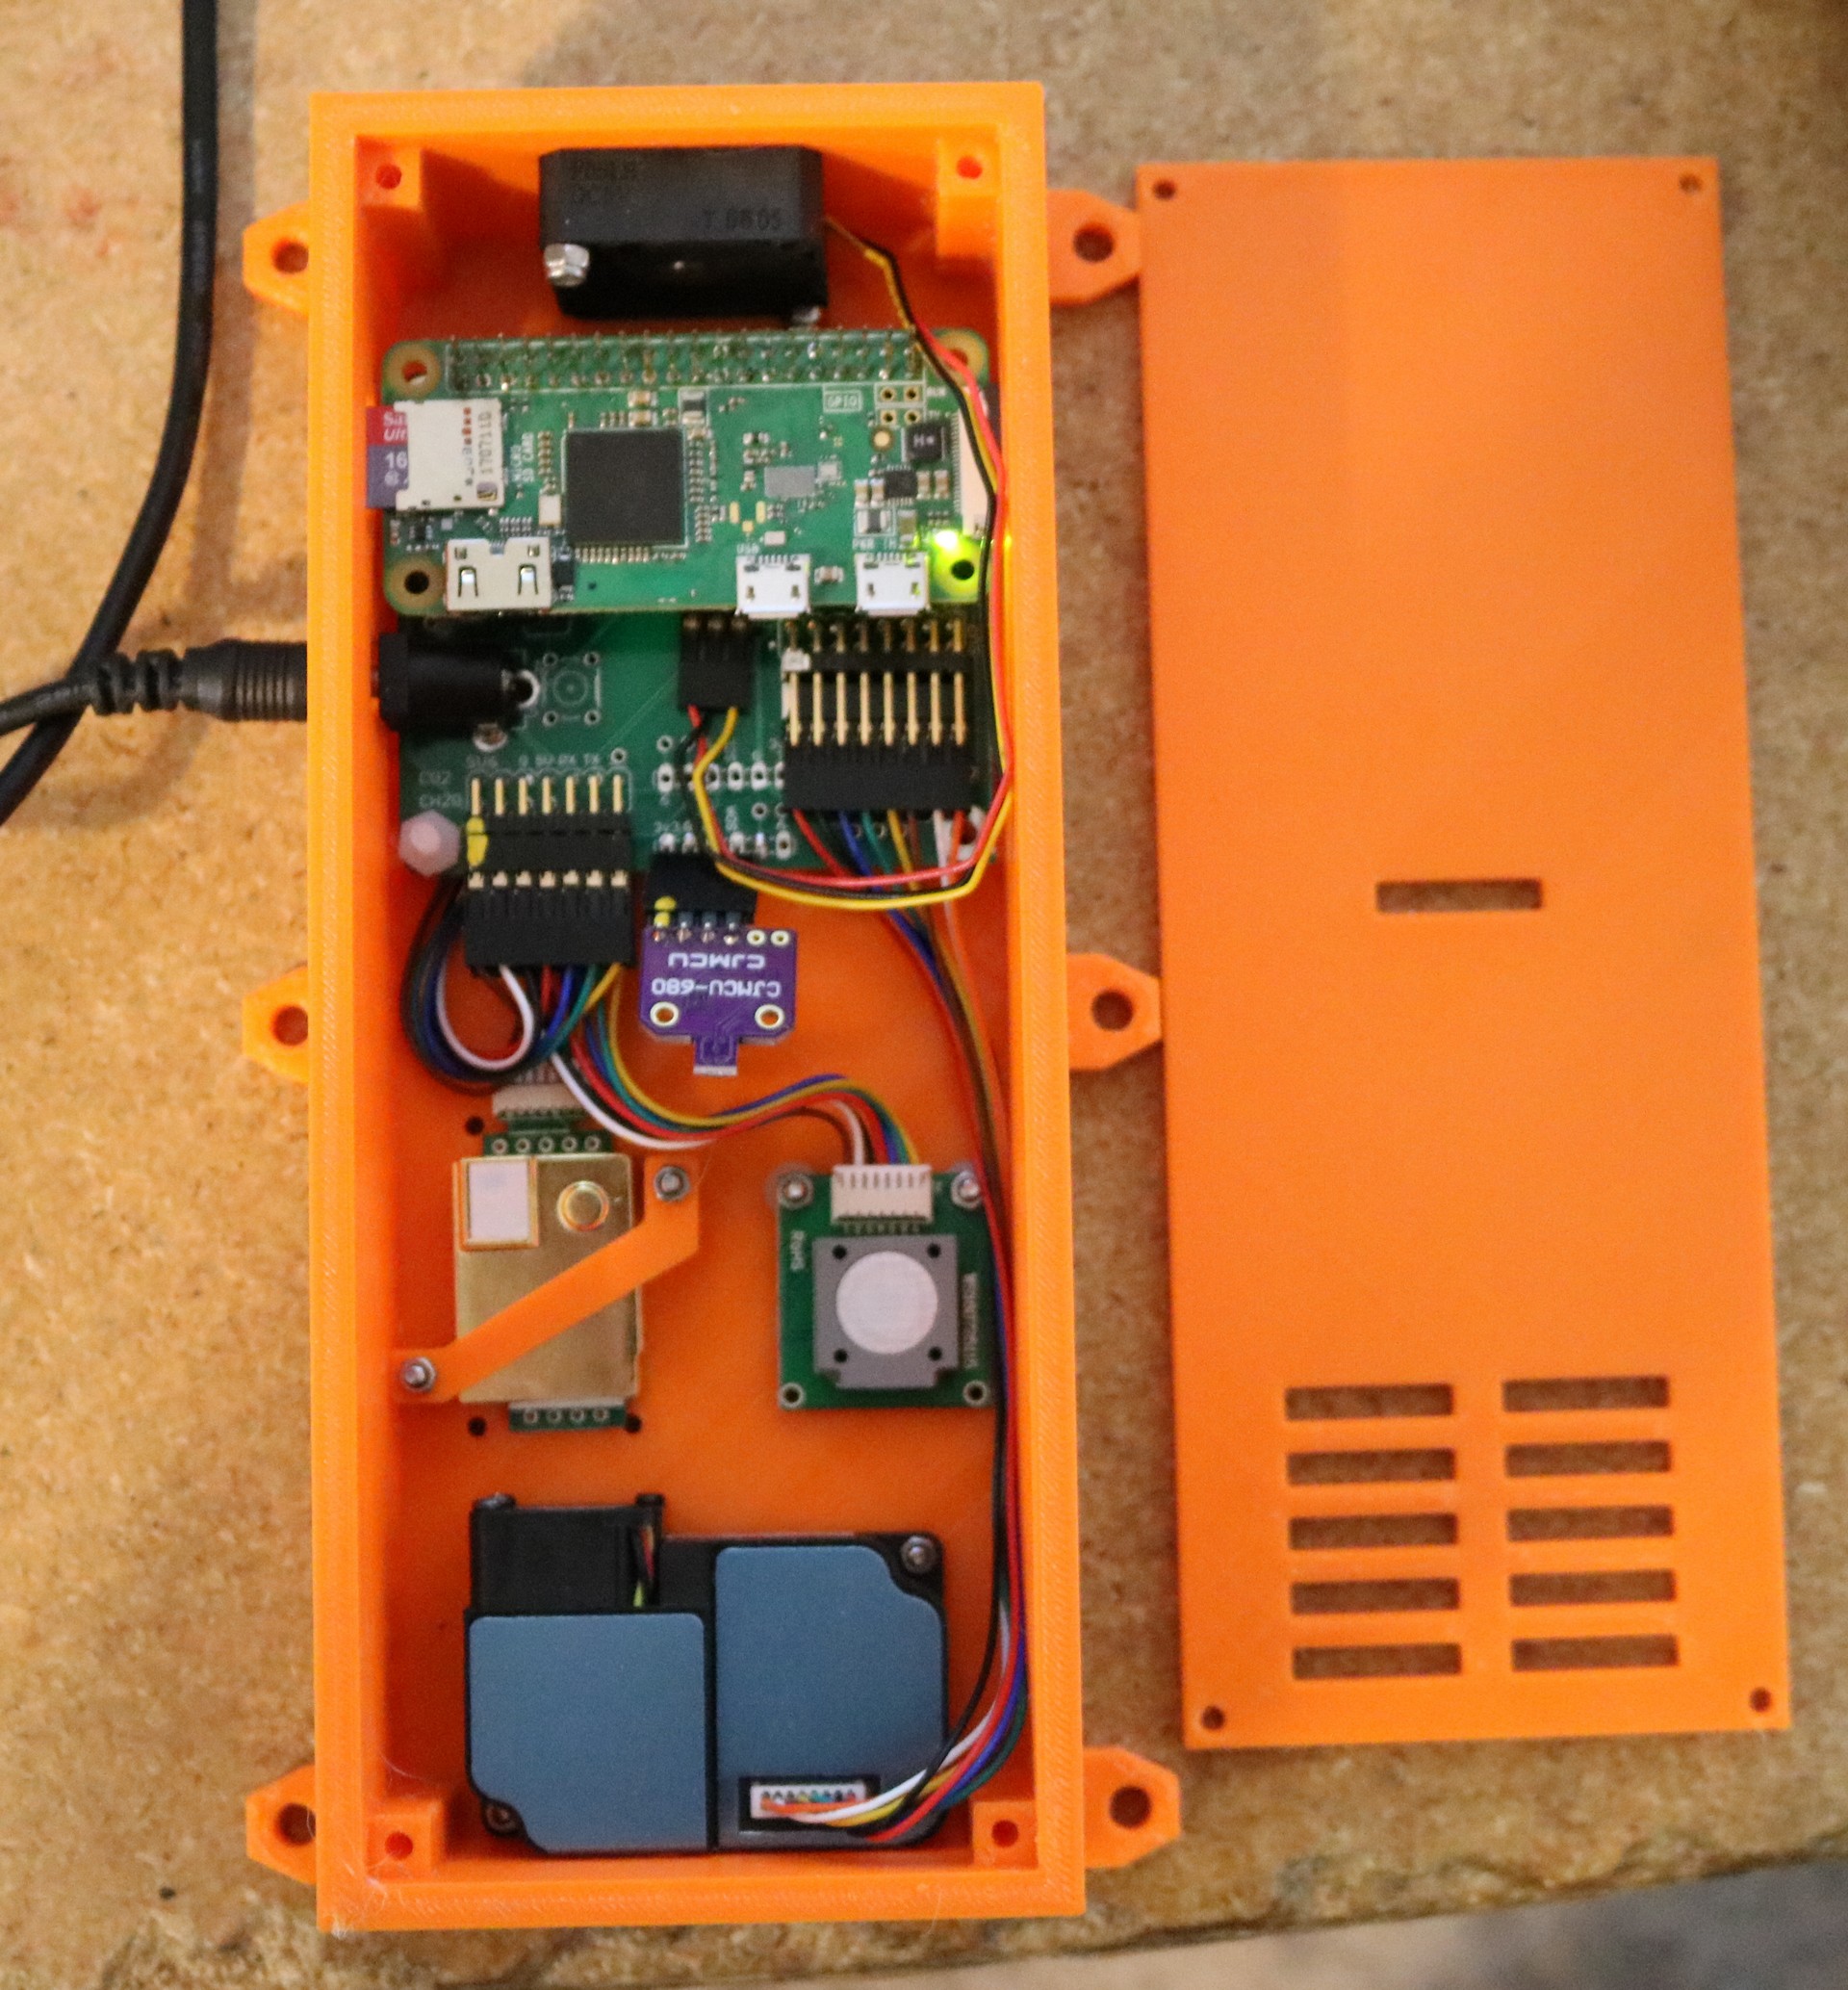
I designed a case and printed it on my Prusa I3 Mk3, and then I mounted the sensors, raspberry pi, breakout board, and fan:
The case has since undergone a few revisions — my most recent “top” has smaller holes as I was concerned about insects gaining entry if I mount one of these outside. At the bottom we have the dust sensor. You can’t quite see it, but there’s a tiny window in the bottom side of the case that lets air into the dust sensor. The dust sensor has it’s own tiny fan. North of the dust sensor are the CO2 (left) and CH2O (right) sensors. Right above those is the BME680. Then there’s the pi and breakout board. Finally at the top is the fan.
The reason I’ve added the additional fan has to do with the BME680 and my desire to get a reasonably accurate temperature. The electronics inside the case give off a small but meaningful amount of heat. Even the BME680 itself gives off heat. It was enough to skew temperature measurements by as much as ten degrees farenheight. I added the additional fan to increase airflow, so the temperature sensor would be dominated by outside air characteristics rather than stagnant air inside of the case.
Software
There’s two components to the software. First is a daemon called “envmond” that I run on the raspberry pi. It makes use of pigpiod to setup several bit-banged serial devices so that it can talk to all of the sensors simultaneously rather than having to multiplex them. As each sensor is polled, the results are sent to a “reporter”. I designed envmond so that several reporters are possible:
- Reporter_Print: Prints to the console
- Reporter_RRD: Writes to a round-robin-data file.
- Reporter_UDP: Sends UDP packets to a server running elsewhere
- Reporer_Prometheus: Allows Prometheus/Grafana to poll envmond
My original plan was to use rrdtool to archive the data and produce graphs. However, rrdtool feels very “last century”. The graphs don’t look all that great and they’re not dynamic. So instead I went with a server monitoring solution that I’m familiar with in another context, Prometheus + Grafana. Prometheus is a time series database and Grafana is a graphing tool that queries that database. It’s a modern dynamic toolset that allows graphs to be zoomed dynamically, automatically refreshed, etc.
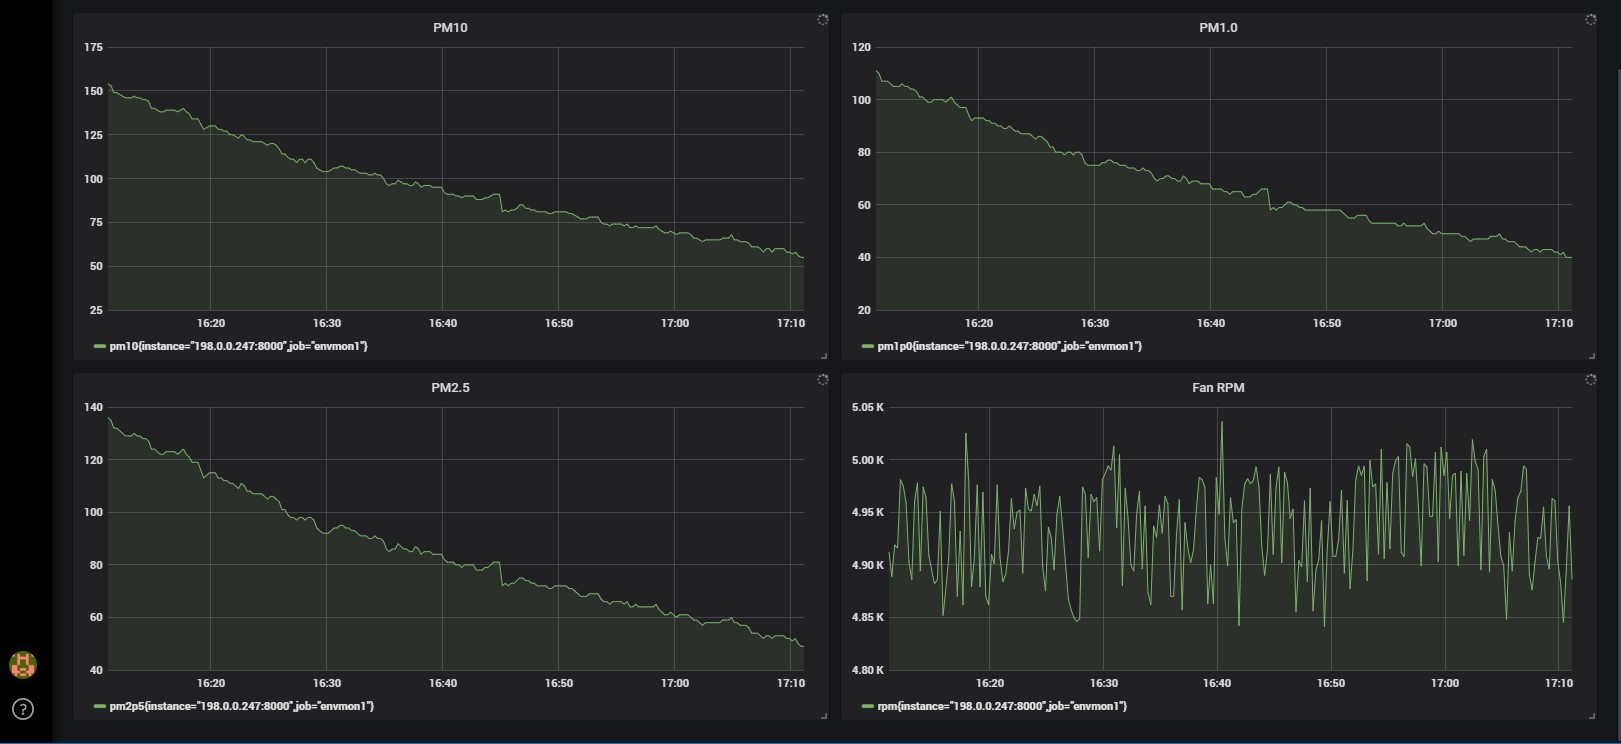
There was an interesting conundrum that came up regarding the fan. I wanted to PWM because most tiny fans spin fast and are very noisy. PWMing it worked fine, but I neglected to consider that this interferes with the RPM sensor on the fan, impeding my ability to readback the RPM that the fan is spinning at. While not absolutely necessary, fan RPM is another thing I can graph. So I researched online and found a technique called “pulse stretching”. Every so often you emit a steady output on the fan driver rather than PWMing. The steady output doesn’t last long enough to affect the speed, but it does last long enough to collect a couple pulses from the RPM sensor and accurate compute the period and RPM.
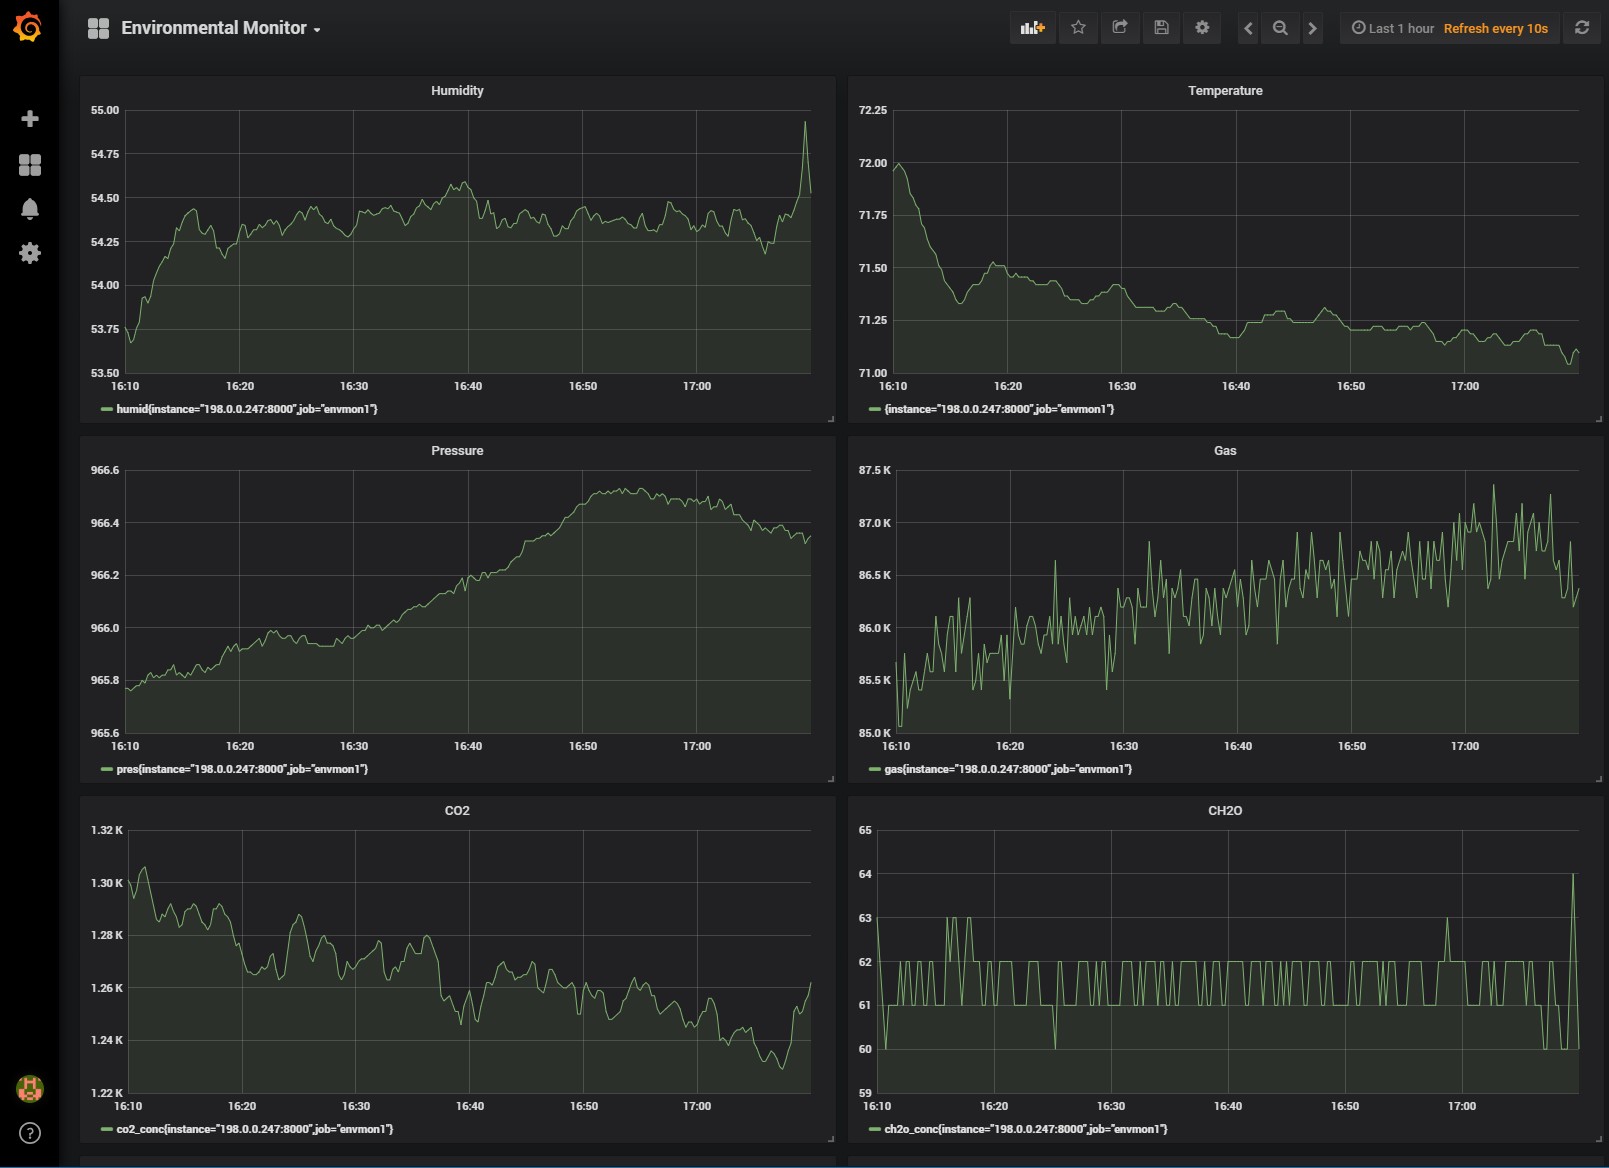
The second component is Prometheus and Grafana, running on a separate machine. Here are a couple images of the Grafana interface:
Prometheus and Grafana are run on a separate computer, in my case in an Ubuntu VM running on one of my servers. Could you run them on a pi? Perhaps, but I don’t know how good the performance would be, or how reliable the storage would be.
Results / Analysis
I few interesting things were apparent, for example whenever I shave in the office the dust sensor picks up particulate matter. The CO2 sensors goes up when people are in the office. I haven’t had a chance to correlate the data with my 3D printing or soldering activities yet — I’m planning on also monitoring the printer and the soldering station with Prometheus so one can see when those activities have taken place. If I do notice something interesting, I’ll be sure to report back.
Github links
The following github repos have relevant software:
- https://github.com/sbelectronics/envmon. This is the environmental monitoring daemon, evnmond.
- https://github.com/sbelectronics/smbaker-infrastructure. This is a dumping ground for server configuration stuff, and is where I’ve placed my helm charts that setup prometheus and grafana.


Hello Doctor Scott,
on the github I can’t find the simple script to read the PPM values from the OZONE ZE25-O3-Ozone-O3 sensor
https://wiki.dfrobot.com/Gravity_IIC_Ozone_Sensor_(0-10ppm)%20SKU_SEN0321#target_6
I should urgently read the PPM values with python with sensor ZE25-O3-Ozone-O3 or with the DFROBBOT Gravity_IIC_Ozone_Sensor, I need the 0-10ppm precision resolution
If it can help, it is urgent.
Meanwhile, thanks and congratulations on your project
Mr. Adduci