Background
I use a virtual private server (VPS) for hosting. I recently moved www.smbaker.com from Goddaddy over to DigitalOcean, and I wanted to spiff up my monitoring of how the server was performing. The Godaddy server was getting a bit antiquated and weird stuff seemed to keep happening to it. I like the DigitalOcean platform, it feels much more agile to me. It’s easy to backup my server to an image file, and it’s easy to restore the server, either to an existing VM (“Droplet”) or to a new one that could be worked on in parallel. At DigitalOcean I don’t feel like I’m pressured into multi-year commitments — I can easily go month-to-month and scale the VPS up for down as necessary. Anyhow, enough background — let’s talk about monitoring.
Prometheus and Grafana
I’ve done a couple prior posts on using Prometheus and Grafana. If I recall correctly, in one post I used the tools to monitor my 3D printer. In another post, I monitored some environmental sensors that I had built. The advantage of the Prometheus and Grafana tools are 1) It’s easy to create professional flexible dashboards with Grafana, and 2) It’s easy to create your own exporters for Prometheus to scrape custom metrics.
Prometheus includes an Alert Manager, which can be configured to watch any metric and send you an email if that metric is in an undesired state. It can be configured to trigger on duration (i.e. “only send an email if the server is down for more than 10 minutes), it can be configured to repeat alerts periodically if the issue is not resolved, and it can be configured to aggregate multiple alerts together into a single email message.
The methodology used by Prometheus is typically pull-based. You run an “exporter” either directly on the device you want to monitor, or you run it somewhere else that you can interact with your device.
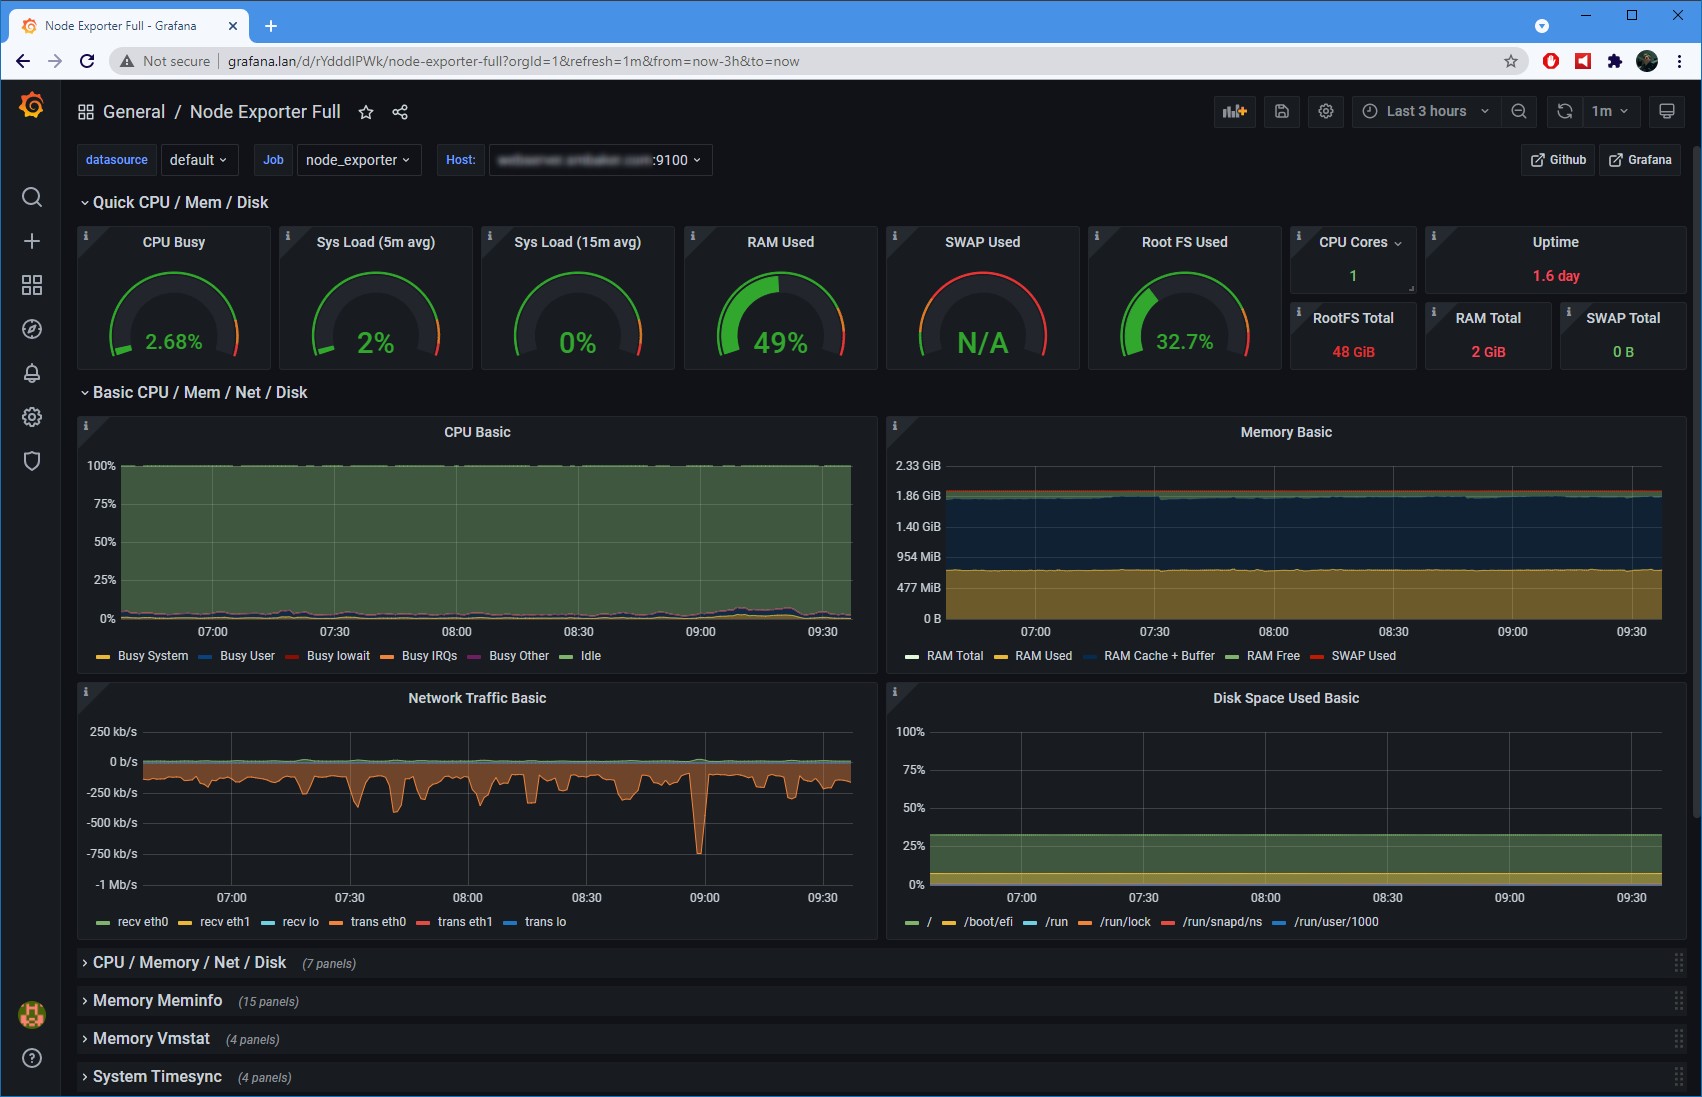
Prometheus Node Exporter
The first exporter I used is called “Prometheus Node Exporter“. This one you run on the device you want to collect metrics from. Node-exporter retrieves a variety of Linux system metrics. For example, it will retrieve the current CPU utilization, memory consumption, network bandwidth, etc. This is useful to tell whether the server is experience resource-related problems, such as the CPU being insufficient or memory becoming exhausted. The data it provides you is useful to determine if and when you need to upgrade the server to more resources.
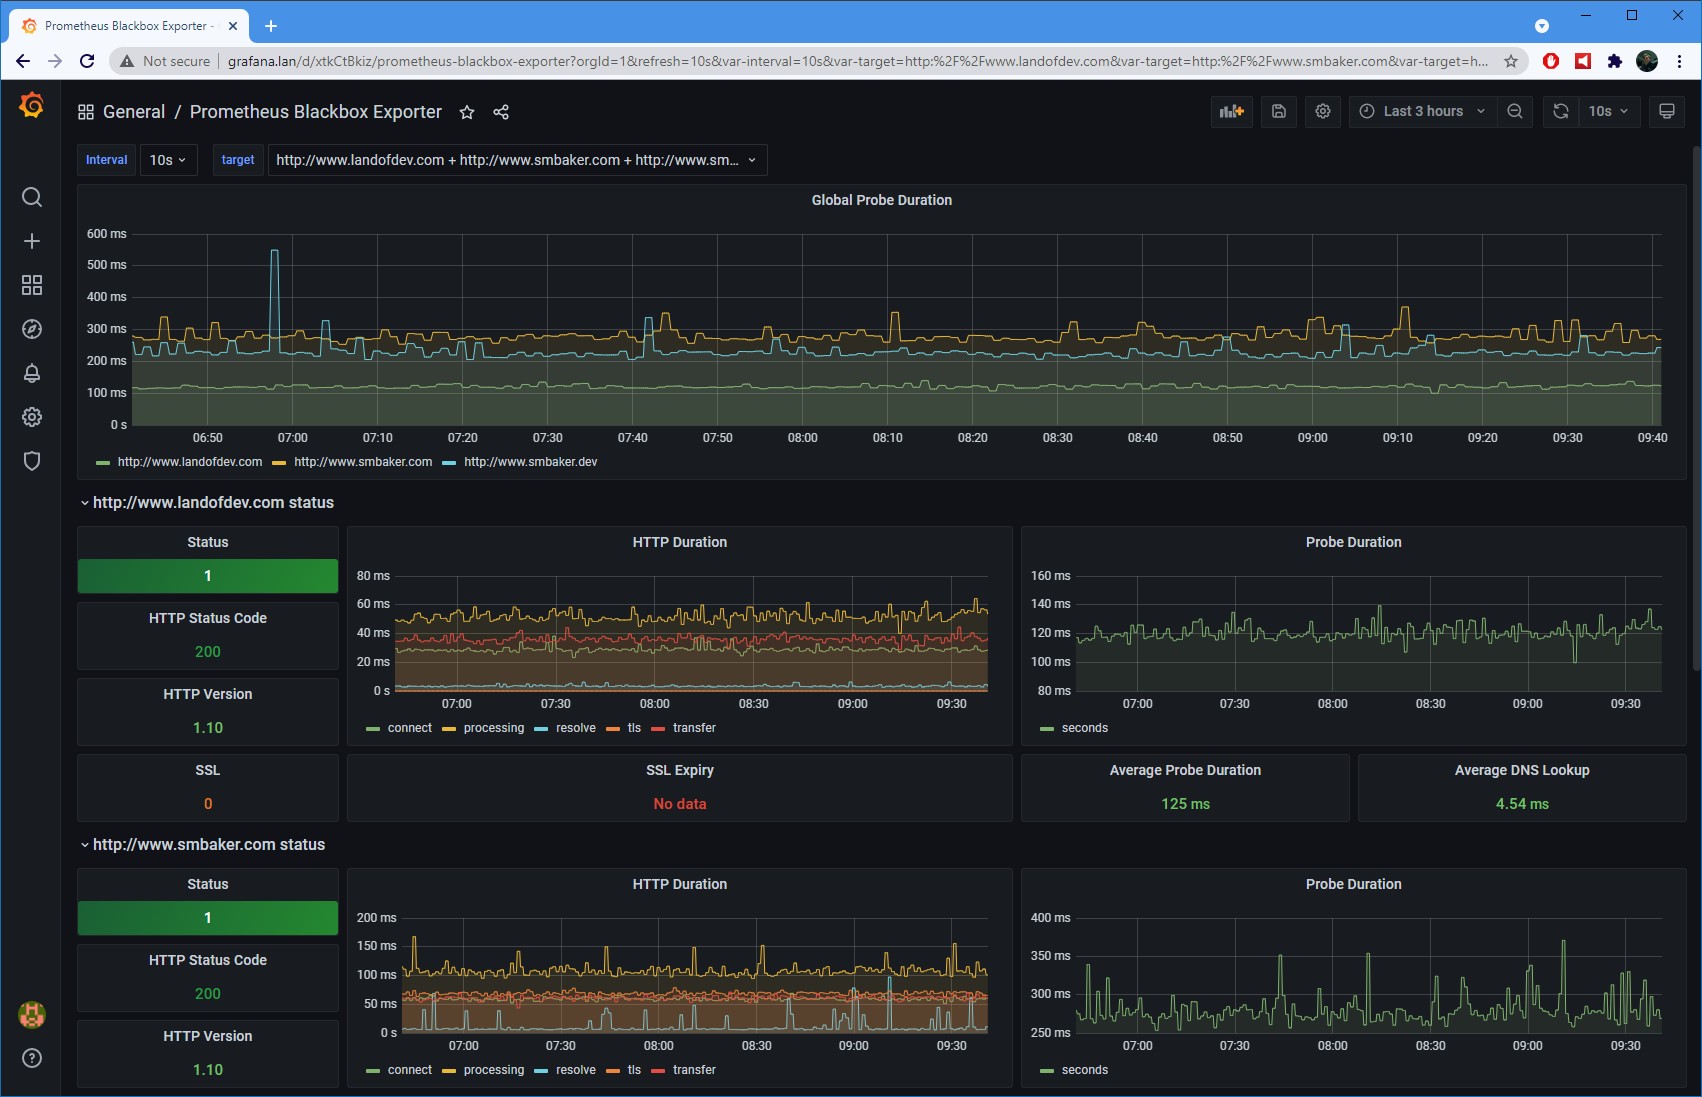
Prometheus Blackbox Exporter
Prometheus Blackbox Exporter is used to monitor the application-level performance of the server, to see how long it takes to fetch URLs. Rather than running it on the server itself, I run the exporter from home and have it periodically retrieve a URL from each web server, recording the time to fetch that URL and the status code (200, 404, etc). Being run from home means that I’m performing an end-to-end test, the same experience that a typical user of the website might receive. If the server is down, I’ll see a 404 error in the exporter, my Grafana dashboard will light up red, and I’ll get an alert from the Prometheus Alert Manager.
This is where Prometheus Alert Manager becomes very useful. Lately I had begun to experience issues where the Godaddy-based server would go down and I wouldn’t notice until some user would send me an email or post a youtube comment “hey you did you know the website is down??“. Now I will get an email and I can investigate the problem and take action in a timely manner.
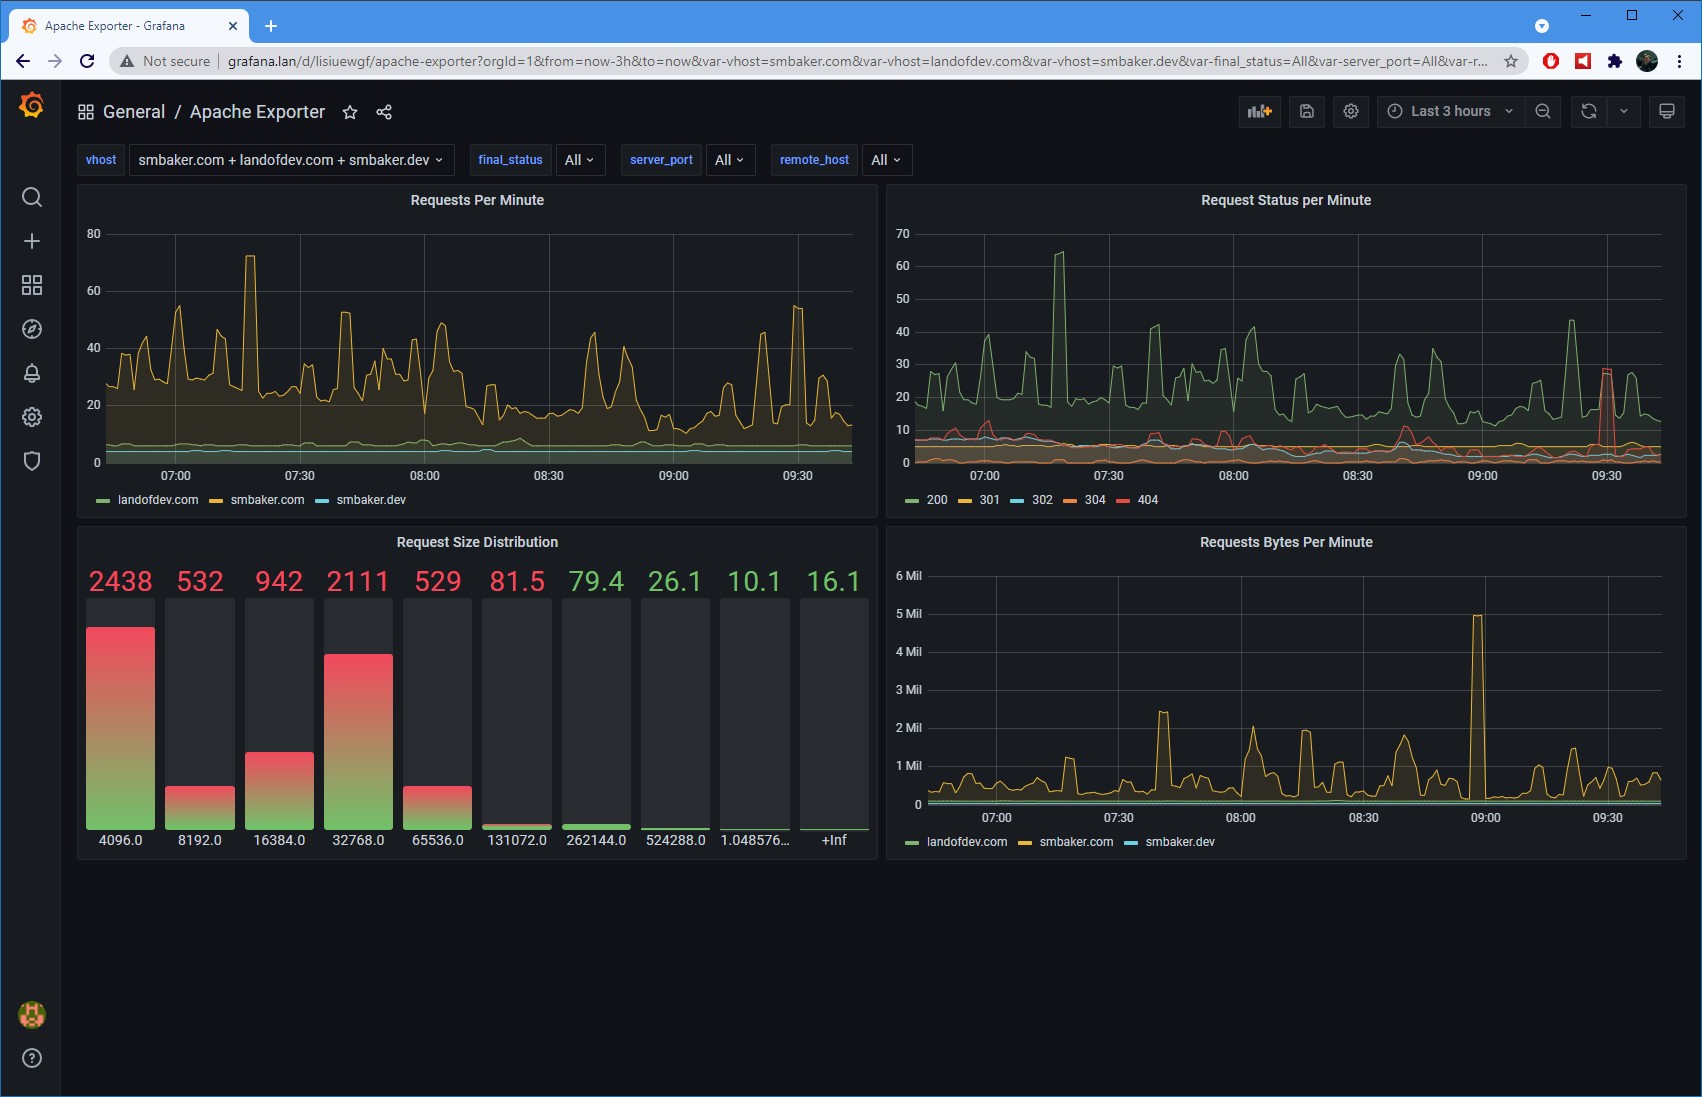
Prometheus Apache Log Exporter
I wrote my own exporter, called prometheus-apache-log-exporter. This is a very simple python script, and illustrates just how easy it can be to write a Prometheus exporter. This was literally nothing more than a Saturday morning project from idea to implementation. This script is run on the server and continuously monitors the log files from the Apache2 web server, producing a hit count and a byte could for each virtual host that is being served. Whereas the other exporters tell me how well the server is functioning, this exporter tells me whether the server is being utilized.
I’ve put this exporter up in my github repository if you’d like to use it yourself.